Track Time, Boost Productivity
Simple and effective time tracking solution for individuals with a focus on ease of use and detailed analytics
No credit card required • Start with 3 free activities
Unlimited historical data included
Features that go beyond basic time tracking
Why InstaClock?
Most time trackers just count hours. InstaClock gives you the insights you need to actually improve your productivity.
Simple Time Tracking
Track your time with just one click. No complex setup or learning curve. Just create an activity and start tracking.
Detailed Analytics
Get deep insights with pie charts, heat maps, bar charts, streak tracking and various distributions. See patterns you never knew existed.
Reports
Select any date range and activities to generate detailed reports with activity wise breakdown, table and distribution graph.
How InstaClock Works
InstaClock makes it easy to track time precisely on your activities and gain detailed insights into your productivity patterns.
Create and Track Activities
Create an activity, give it a name, pick a color and just start tracking it. No complex setup required - just simple, intuitive activity creation and tracking.
Activity Details
Gain insights including record details, top streaks, time spent on each activity on weekly, monthly and yearly basis.
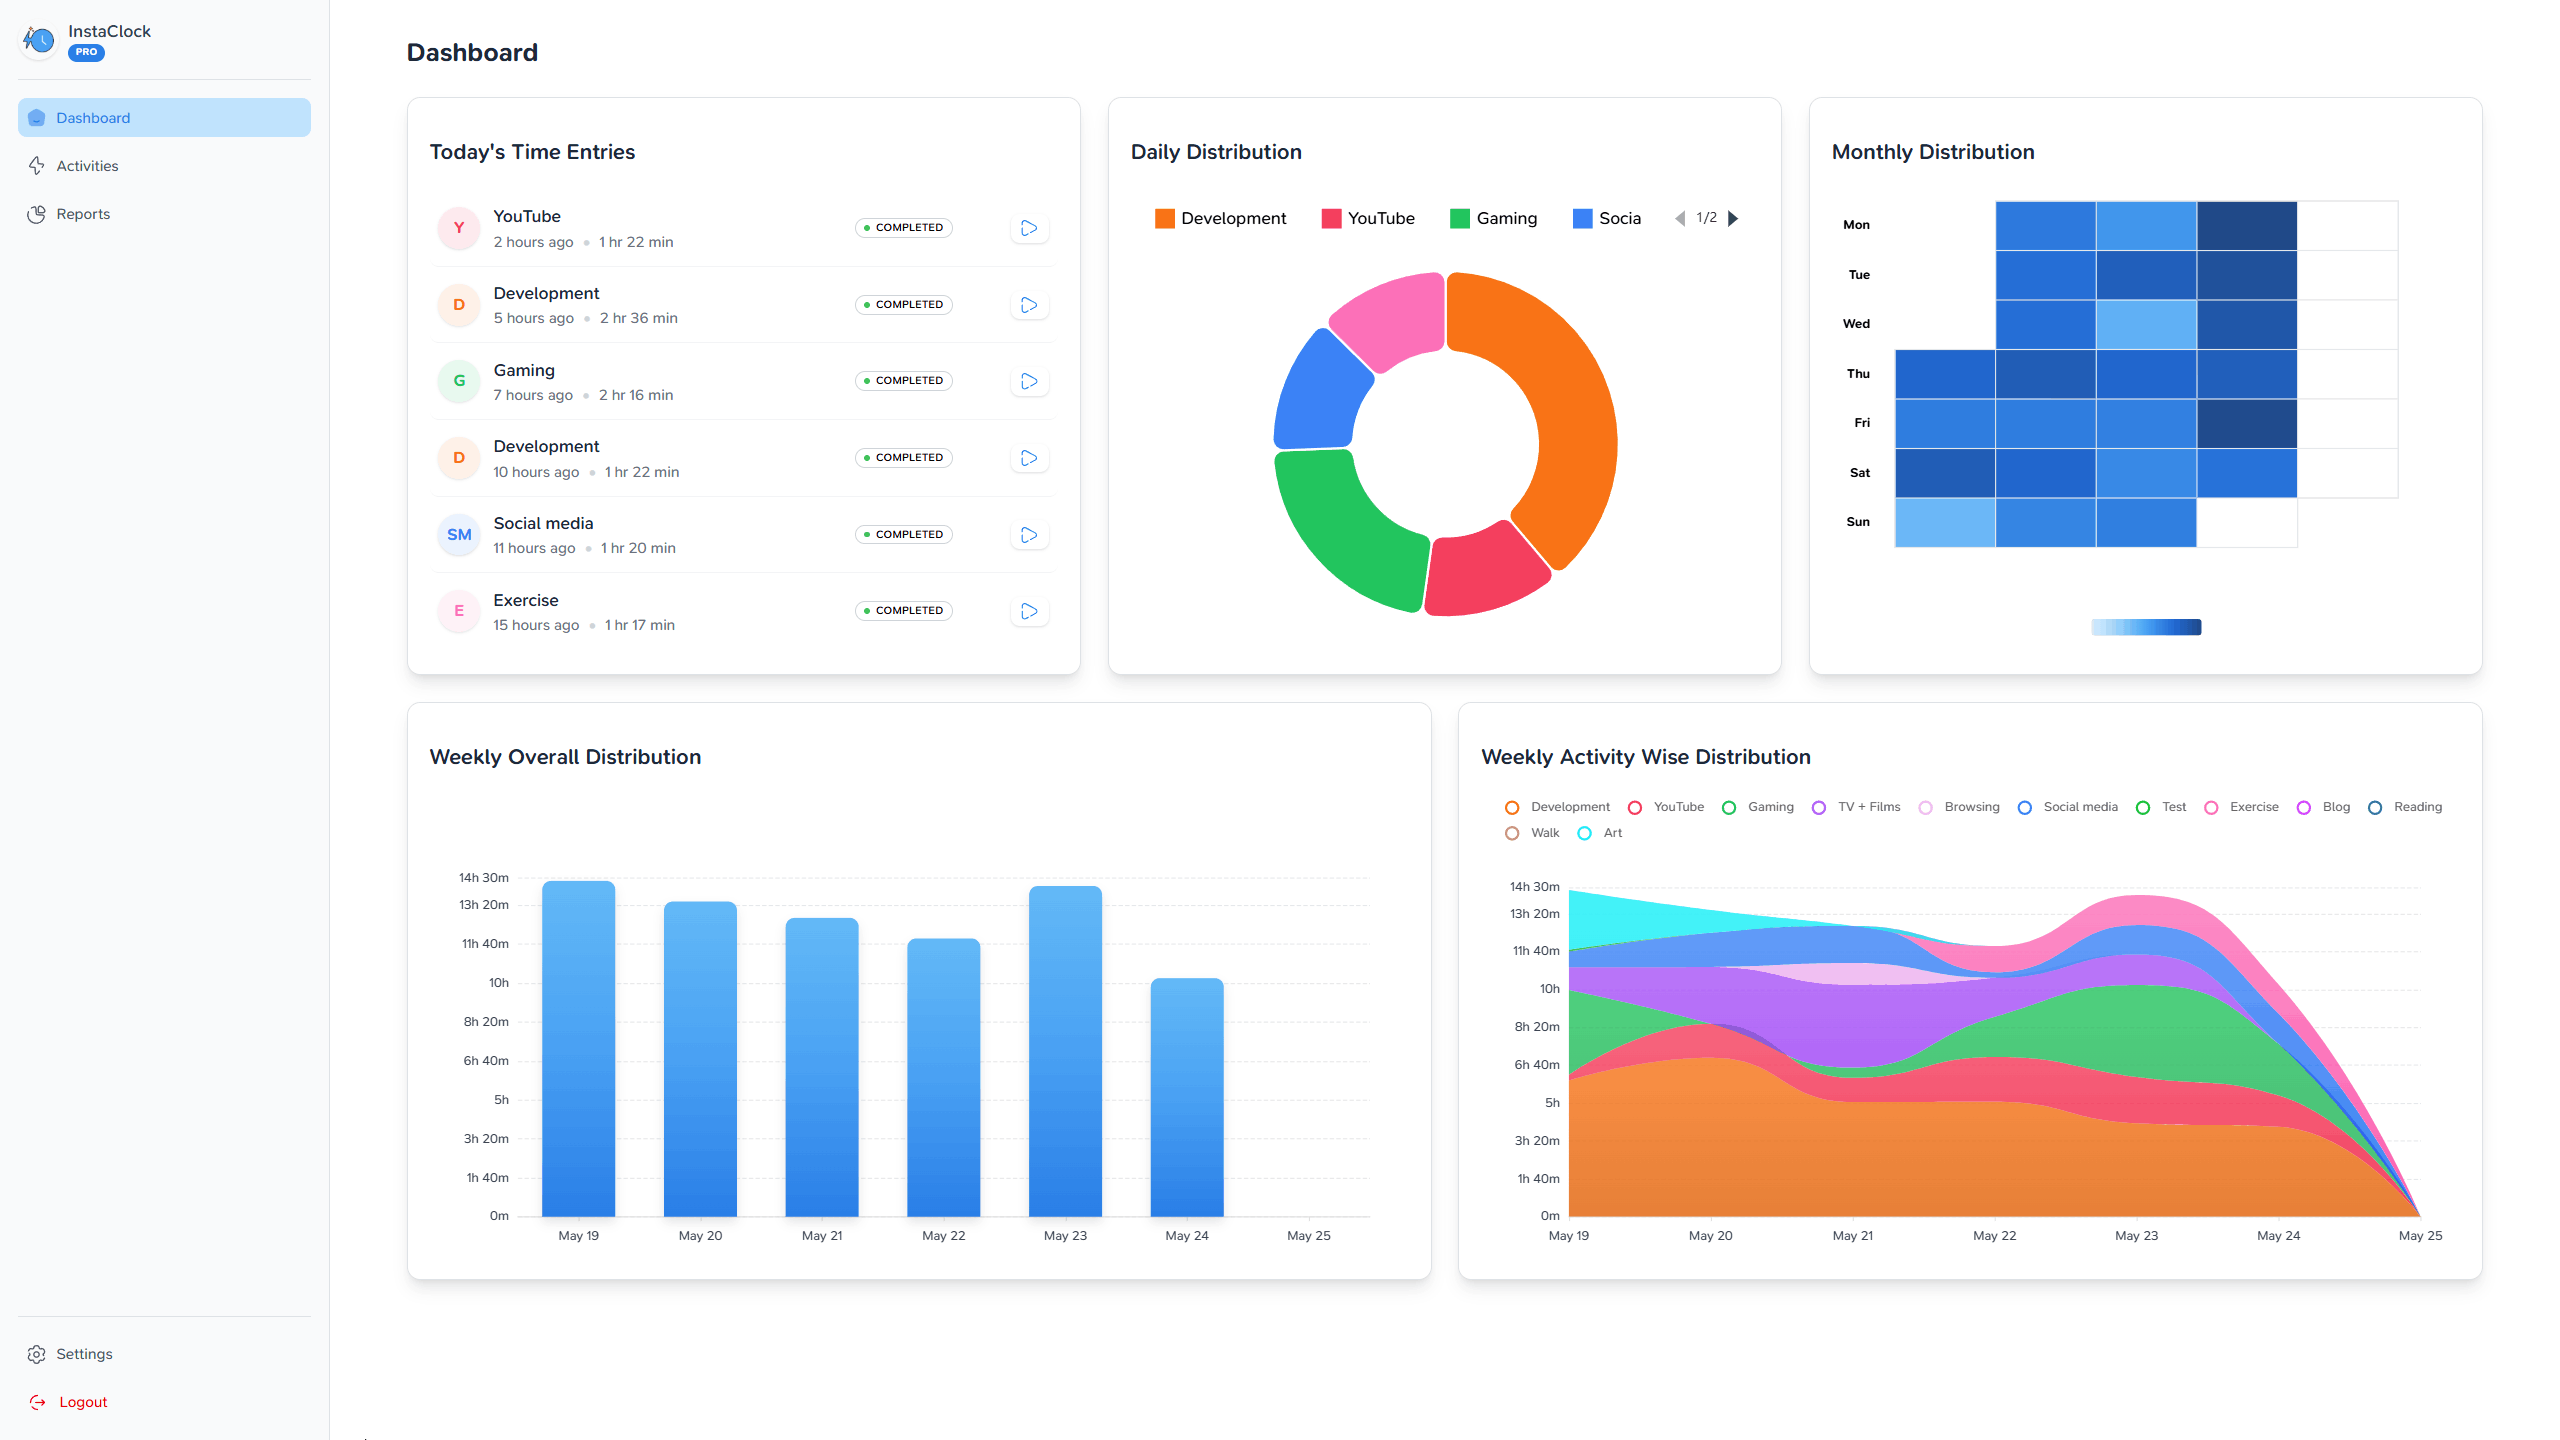
Dashboard
View detailed analytics including pie chart, heat map, activity tracking over the week and month, and more.
No credit card required • Start with 3 free activities
All the features you need for effortless time tracking
InstaClock provides comprehensive analytics to help you understand your productivity patterns and make data-driven decisions.
Comprehensive Dashboard
Today's entries, activity breakdown pie chart, monthly heat map, weekly bar chart, and weekly activity area chart - all in one view.
Activity Deep Dive
Average time, longest session, streak tracking, and time distribution across days, weeks, and months for each activity.
Custom Reports
Select any date range and activities to generate detailed reports with breakdowns, tables, and time-based graphs.
Streak Tracking
See your top 10 streaks for each activity and stay motivated to maintain consistency in your work habits.
Time Distribution
Understand your patterns with weekly, monthly, and yearly time distribution charts showing when you're most productive.
Email Reports
Get weekly email reports with detailed activity analysis, time breakdowns, and week-over-week comparisons.
Simple, Transparent Pricing
Start free and upgrade when you need more activities and email
reporting.
No hidden fees, no complex tiers.
Switch to Yearly and get 2 months free
Free
Perfect for getting started
- Up to 3 activities
- Complete dashboard analytics
- Unlimited historical data
- CSV data export
- Email reports
Pro
For power users who need more features
- Unlimited activities
- Complete dashboard analytics
- Unlimited historical data
- CSV data export
- Weekly email reports with insights
All plans include unlimited time tracking and data ownership. No credit card required to start.
Frequently Asked Questions
You can install InstaClock on your desktop or mobile device like a native app for quick access via Progressive Web App (PWA).
On Desktop (Chrome/Edge): Look for an install icon in the address bar when visiting the app URL. Click it and follow the prompts.
On Mobile (iOS/Android): Visit the app URL in your browser and use the "Share" or "Menu" option to select "Add to Home Screen".
InstaClock provides comprehensive analytics including:
- Daily time entry summaries and activity breakdowns
- Pie chart showing time distribution across activities
- Monthly heat map visualizing your productivity patterns
- Weekly bar charts and area charts for trend analysis
- Streak tracking to maintain consistency
- Time distribution analysis by day, week, and month
- Custom reports for any date range and activity selection
Yes! You can export both your activity data and time entry data in CSV format. Pro users also receive weekly email reports with detailed analytics and week-over-week comparisons.
Free accounts can track up to 3 activities, which is perfect for getting started. Pro accounts have unlimited activities, so you can track as many projects, tasks, or categories as you need.
Ready to take control of your time?
Stop tracking your time and start understanding it.
No credit card required • Start with 3 free activities